
Transforming SVG to GeoJSON
Use Allmaps to move lines and polygons between a historical map image and a modern map. SVG shapes drawn on the image use pixel coordinates, while GeoJSON uses longitude and latitude. The image’s Georeference Annotation supplies the control points that connect these coordinate systems.
This guide starts with GeoJSON of Broadway in Manhattan. You’ll transform the route into an SVG overlay on a 1921 aerial photograph, then convert an SVG line back into GeoJSON for use in a GIS or web map.
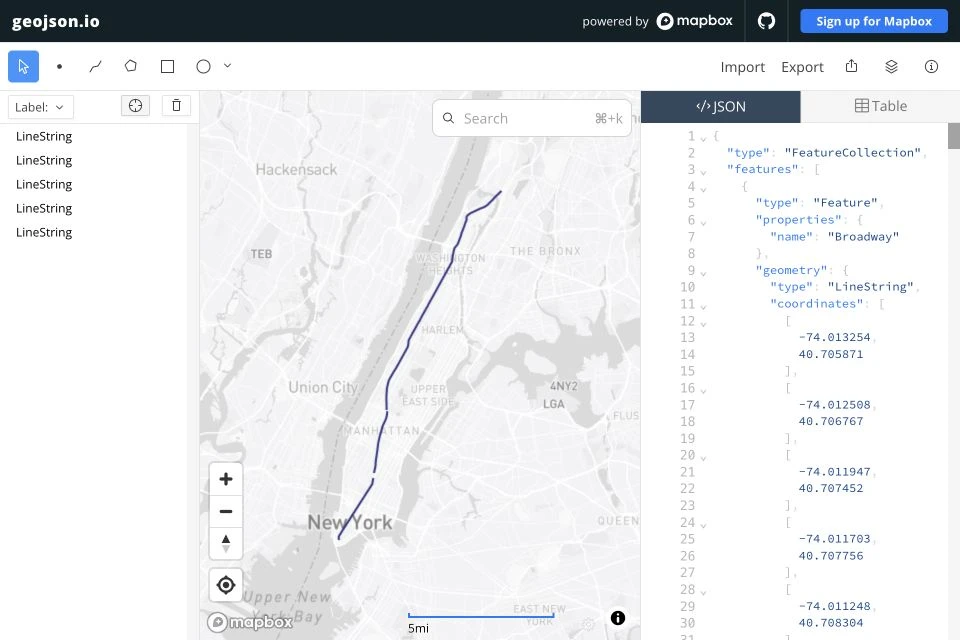
The complete Broadway GeoJSON in geojson.io.
From GeoJSON to SVG
Transform the geographic coordinates to image pixels to draw Broadway over a 1921 aerial photograph of Manhattan from the Library of Congress. Pan and zoom to explore the route:
Loading the photograph and Broadway…
Pass the Broadway FeatureCollection directly to
GcpTransformer.transformGeojsonFeatureCollectionToSvgString():
import { parseAnnotation } from '@allmaps/annotation'import { GcpTransformer } from '@allmaps/transform'
const [annotation, broadway] = await Promise.all([  fetch(    'https://annotations.allmaps.org/maps/48da96d9296515a6@cbd8273e25cd5aca'  ).then((response) => response.json()),  fetch(    'https://docs.allmaps.org/examples/transforming-coordinates/broadway.geojson'  ).then((response) => response.json())])
const [georeferencedMap] = parseAnnotation(annotation)const transformer = GcpTransformer.fromGeoreferencedMap(georeferencedMap)
const svg = GcpTransformer.transformGeojsonFeatureCollectionToSvgString(  transformer,  broadway)
console.log(svg)
The result contains five <polyline> elements in the original image’s pixel
coordinates. When displaying the SVG over the image, give it a viewBox
matching the image dimensions and set the lines’ stroke and fill styles.
From SVG to GeoJSON
For the reverse direction, download the
full Broadway SVG
and its Georeference Annotation.
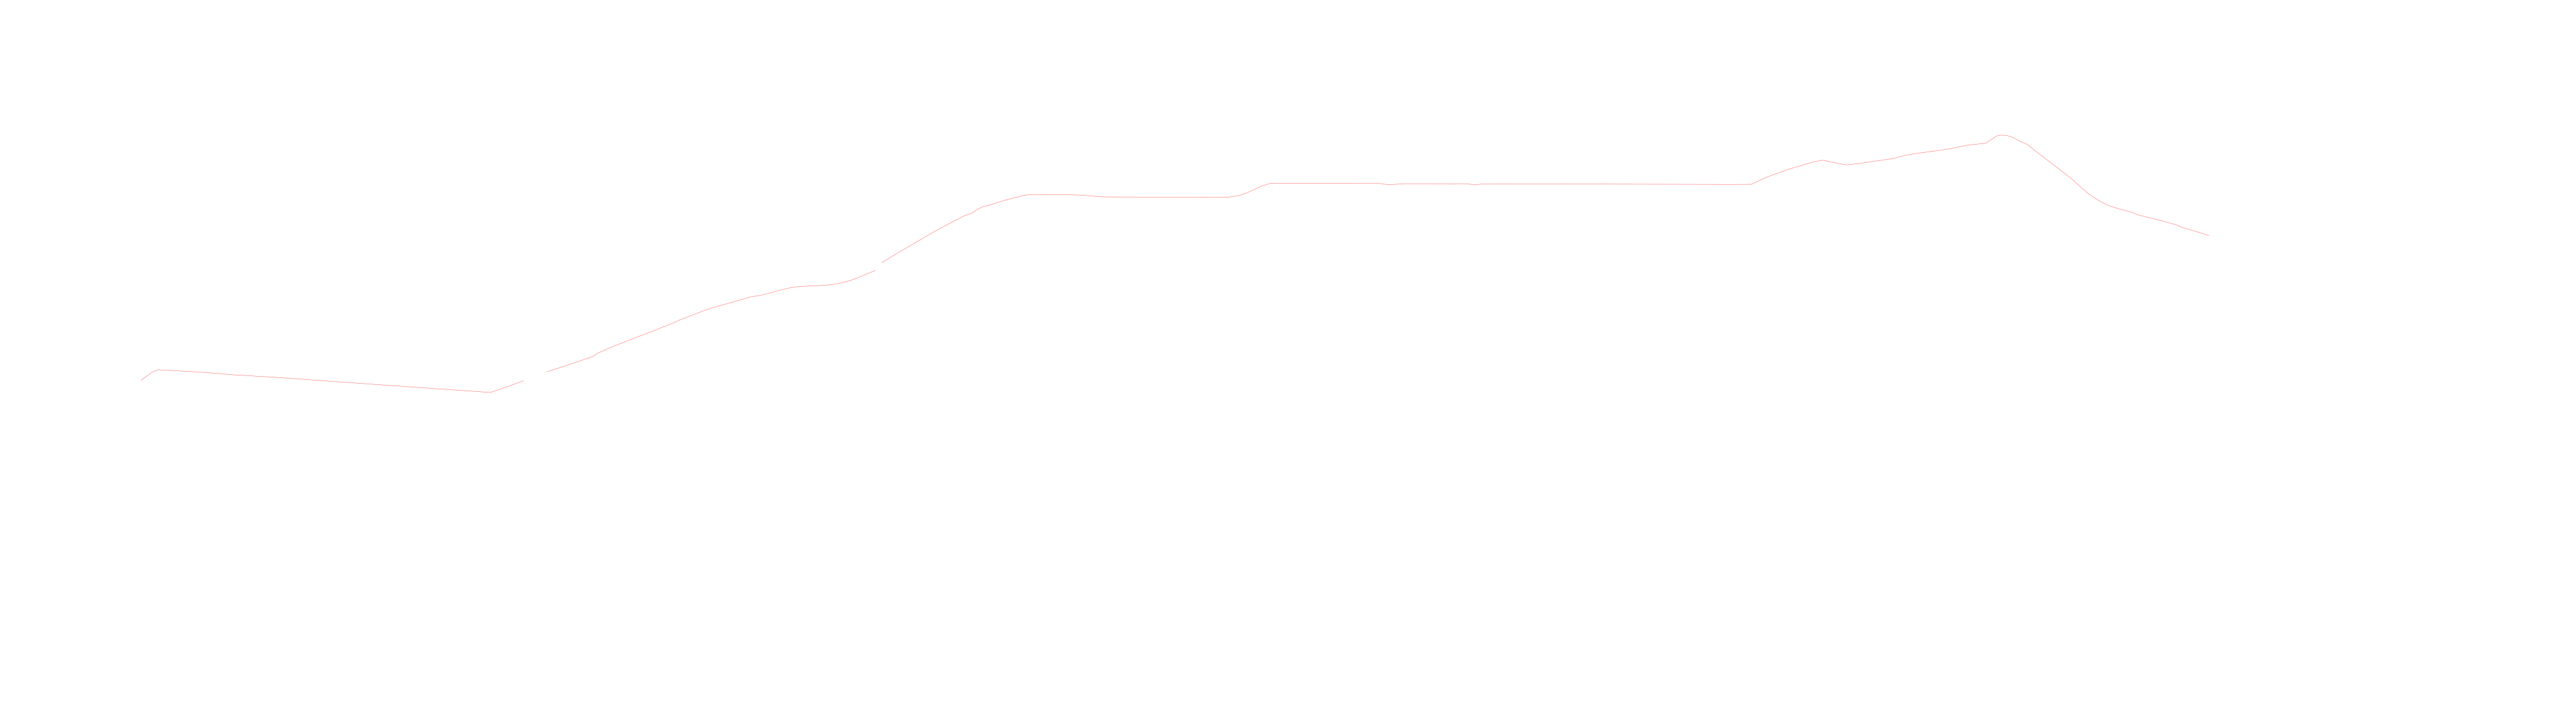
Its five <polyline> elements use the full-resolution photograph’s pixel
coordinates, and its viewBox covers the full image: 0 0 30387 8460.
import { parseAnnotation } from '@allmaps/annotation'import { GcpTransformer } from '@allmaps/transform'
const [annotation, svg] = await Promise.all([  fetch(    'https://annotations.allmaps.org/maps/48da96d9296515a6@cbd8273e25cd5aca'  ).then((response) => response.json()),  fetch(    'https://docs.allmaps.org/examples/transforming-coordinates/broadway.svg'  ).then((response) => response.text())])
const [map] = parseAnnotation(annotation)const transformer = GcpTransformer.fromGeoreferencedMap(map)const geojson = GcpTransformer.transformSvgStringToGeojsonFeatureCollection(  transformer,  svg)
For your own drawings, use <polyline> for lines or <polygon> for areas.
Give each shape explicit coordinates in the original image’s pixel system.
Allmaps does not support SVG <path> elements or the transform attribute,
including translate(), rotate(), and scale().
Using Allmaps CLI
You can also transform SVG to GeoJSON in a terminal with Allmaps CLI. Download the Broadway SVG, then fetch the Georeference Annotation and transform the SVG:
curl --fail --location \  'https://annotations.allmaps.org/maps/48da96d9296515a6@cbd8273e25cd5aca' \  --output annotation.json
allmaps transform svg \  --annotation annotation.json \  < broadway.svg > broadway-transformed.geojson
The --annotation option supplies the map’s control points and transformation
type. The command reads the SVG from standard input and writes a GeoJSON
FeatureCollection with five LineString features to broadway-transformed.geojson.